

Identifying distortions present within a French-language corpus is a crucial step before launching any model training. These biases can result from an unequal distribution of classes, linguistic stereotypes, or unbalanced sampling. Without early detection, they propagate and degrade robustness, fairness, and ultimately the trust placed in artificial intelligence. This article explores in detail the methods to uncover these anomalies, the suitable tools to quantify them, and best practices to mitigate them.
Somaire
In Brief
🔍 Linguistic biases and underrepresented classes lurk in every French dataset: checking the distribution of genders, regions, and language registers is essential from the initial exploration.
🚦 Techniques such as exploratory data analysis and the use of parity metrics automatically detect disparities. A simple confusion matrix or an equal opportunity score is often enough to provide a first assessment.
📊 To correct, balance your samples, apply reweighting methods, or integrate bias mitigation algorithms (reweighing, adversarial debiasing). The combined workflow with unit tests ensures that nothing slips through the cracks.
Understanding Biases in French-language Datasets
Origins and Types
Biases take root at several levels: during collection (non-representative sources), preprocessing (automatic removal of certain data), or even at annotation time (subjective judgments of annotators). In a French context, notable issues include geographic imbalances (overrepresentation of France to the detriment of Quebec or Francophone Africa), social biases (non-inclusive societal references), and register variations (oral vs written, slang vs standard). These distortions, sometimes subtle, shape how the model will respond to queries in production.
Concrete Impacts on Models
If overlooked, a virtual assistant trained on a corpus centered on Parisian French may misunderstand regional expressions or propagate stereotypes. Consequences range from simple misunderstandings to unfair automated decisions (loan refusals, candidate screening). Moreover, overall performance degrades: precision gaps of up to 15% are observed between poorly distributed linguistic subgroups.
Methodologies to Detect Biases
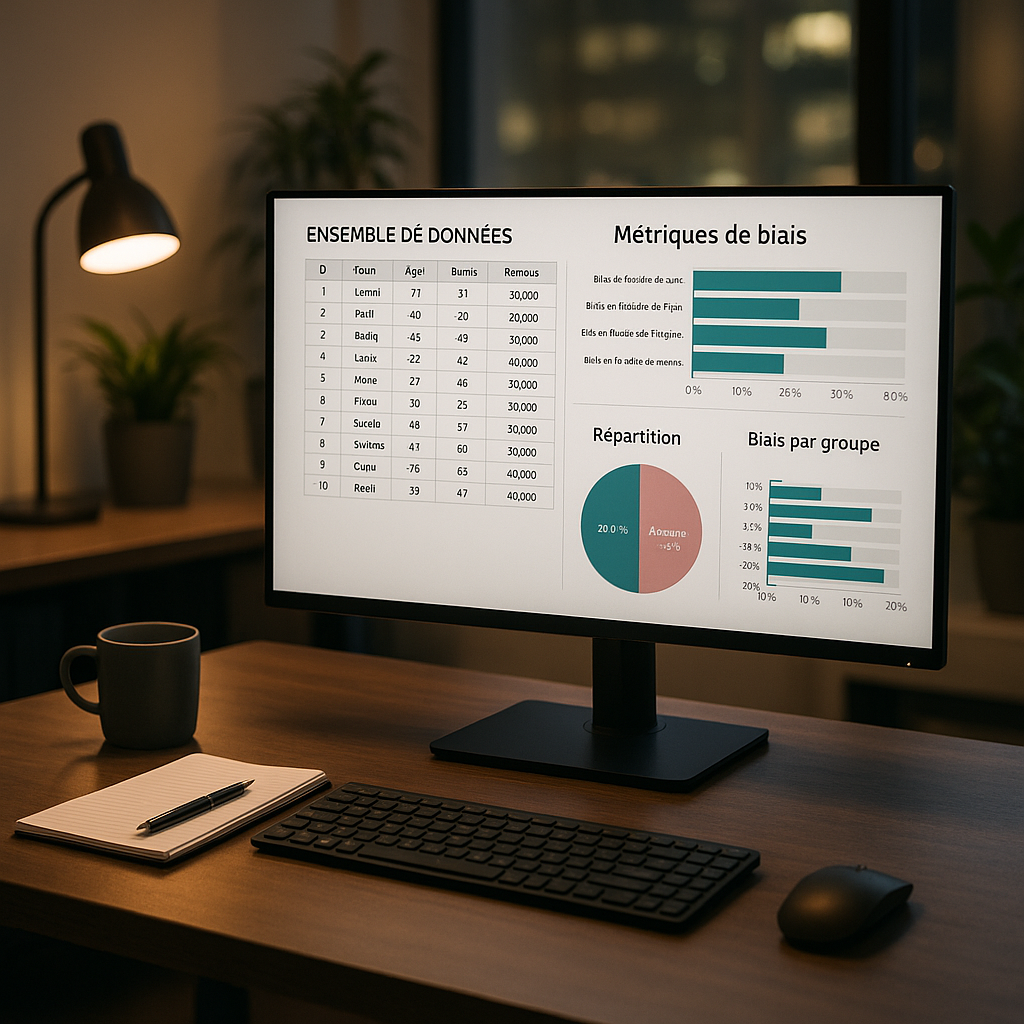
Exploratory Data Analysis (EDA)
EDA forms the foundation of any bias detection approach. We start by examining the label distribution, the token frequency, and the distribution of demographic attributes. Simple visualizations – histograms, box plots, correlation matrices – are often enough to highlight anomalies. For example, a heatmap showing the frequency of terms specific to each French-speaking region will highlight underutilized areas.
Dedicated Tools and Metrics
Several open-source libraries help quantify disparities:
- Fairlearn: generator of reports on demographic parity.
- AIF360: catalog of metrics (disparate impact ratio, equality of odds).
- What-If Tool: visual interface to compare scenarios with and without mitigation.
Below is an overview of the most common metrics:
| Metric | Description | Recommended Threshold |
|---|---|---|
| Disparate Impact Ratio | Ratio of favorable outcome rates between groups | > 0.8 |
| Equality of Odds | Difference in false positive and false negative rates | < 5% |
| Statistical Parity | Difference in probability of positive outcome | < 2% |
Best Practices to Correct or Mitigate Biases
Detection is only the first step: next, the dataset or model must be adjusted. Here are some proven strategies:
- Sample Reweighting: assign greater weight to underrepresented classes.
- Targeted Data Augmentation: synthesize or collect missing examples (regional variants, specific jargon).
- Adversarial Debiasing: integrate an adversarial network that penalizes prediction of the sensitive attribute.
- Test-driven Development: write unit tests to verify fairness at each iteration.
A combination of these approaches is often preferred to avoid side effects, such as overfitting on a small group or overall performance loss.
Use Cases and Concrete Examples
Several French-speaking organizations have already implemented these methods:
The Caisse des Dépôts reduced the precision gap between regions by 30% during document classification by applying pre-training reweighing.
In the banking sector, a credit scoring using AIF360 detected a systematic bias against certain Maghreb-sounding first names, leading to a complete revision of the annotation pipeline.
In Practice: Recommended Workflow
A typical protocol unfolds in five phases:
- Initial collection and labeling.
- Exploratory analysis (EDA) and bias metrics.
- Correction (reweighing, augmentation).
- Retraining and re-measurement.
- Controlled deployment and post-production monitoring.
Each step should be accompanied by clear reporting and tracking of key indicators, without placing responsibility solely in the hands of one team.
FAQ
Why are biases more difficult to detect in French ?
Geographical diversity, spelling variations, and the lack of mature tools specifically designed for French complicate diagnosis. It is often necessary to adapt or create regional lexicons to enrich the analysis.
How much time should be devoted to EDA ?
A minimum of 10% of the total development time proves essential to establish a reliable overview. Consider this as an investment that avoids costly backtracking.
What resources to deepen knowledge ?
Consult the documentation of Fairlearn, AIF360, and explore French-speaking conferences on ethical AI (e.g., Rencontres IA Sorbonne).
