
| Key points | Details to remember |
|---|---|
| ⚡ Network latency | Measurement of packet round-trip delay |
| 🔍 Rank-by-ping.com | Intuitive interface and geographic distribution |
| 🛠 Competing tools | Classic tools (ping, MTR) and SaaS platforms |
| 📊 Criteria | Accuracy, variability, bias |
| 🚀 Results | Quantified comparison according to different scenarios |
| 🧰 Best practices | Tips for obtaining reliable measurements |
Are you looking to find out if Rank-by-ping.com outperforms the classic ping and MTR in terms of latency reliability? By exploring the collection methods, the diversity of test points, and the analysis algorithms, we highlight the strengths and limits of each solution. Let’s dive into the heart of transmission delays to understand which of these tools delivers the most robust data.
Somaire
Understanding network latency
What is latency?
Latency is defined as the time required for a data packet to make a round trip between a client and a server. Unlike simple throughput, it involves distance, the quality of connections, and possible overload of intermediate equipment. In practice, latency is measured in milliseconds (ms) using ICMP requests or specialized probes.
The different components of latency
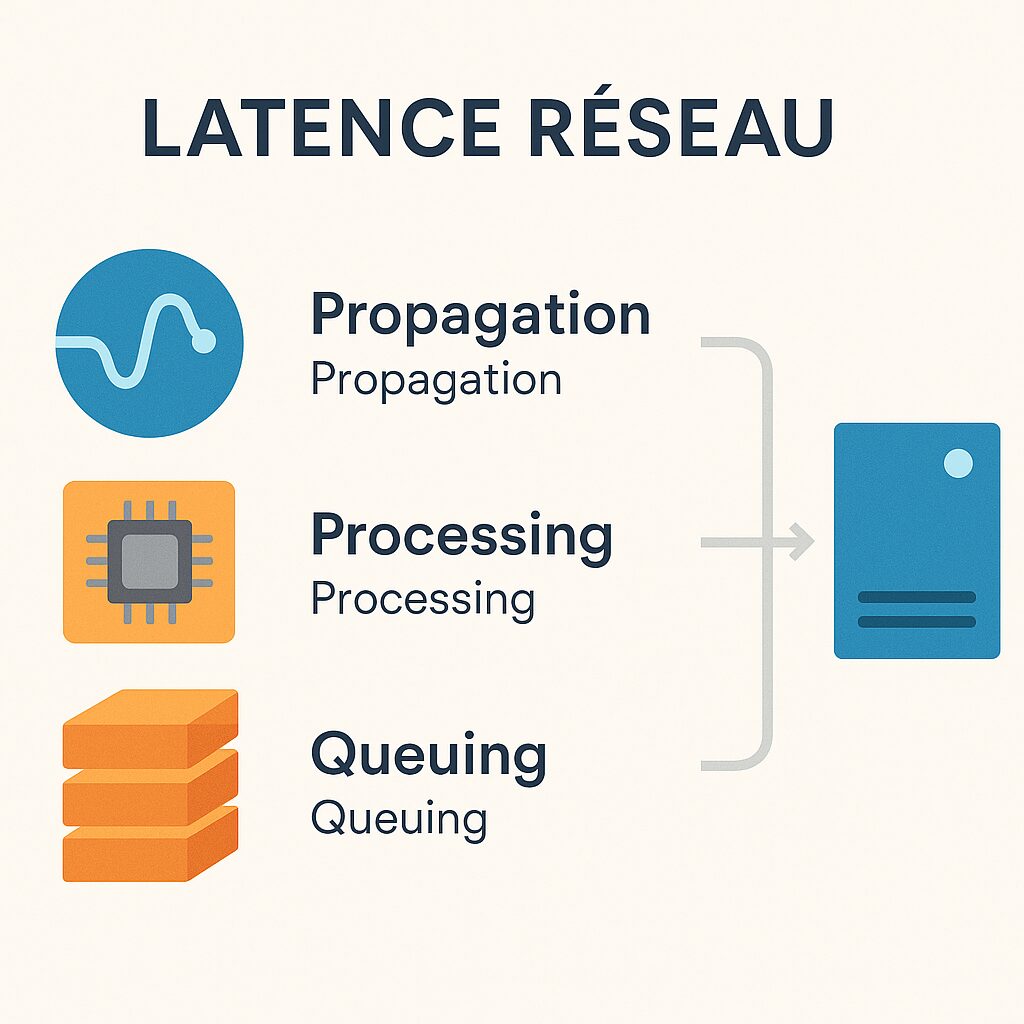
Latency breaks down into several segments: propagation time along fiber optics, processing delay in routers and switches, and queuing delay in case of congestion. Each of these elements can vary depending on the time, network load, or geography. Understanding these factors helps better interpret discrepancies in seemingly identical measurements.
Principle of Rank-by-ping.com
Technical approach and infrastructure
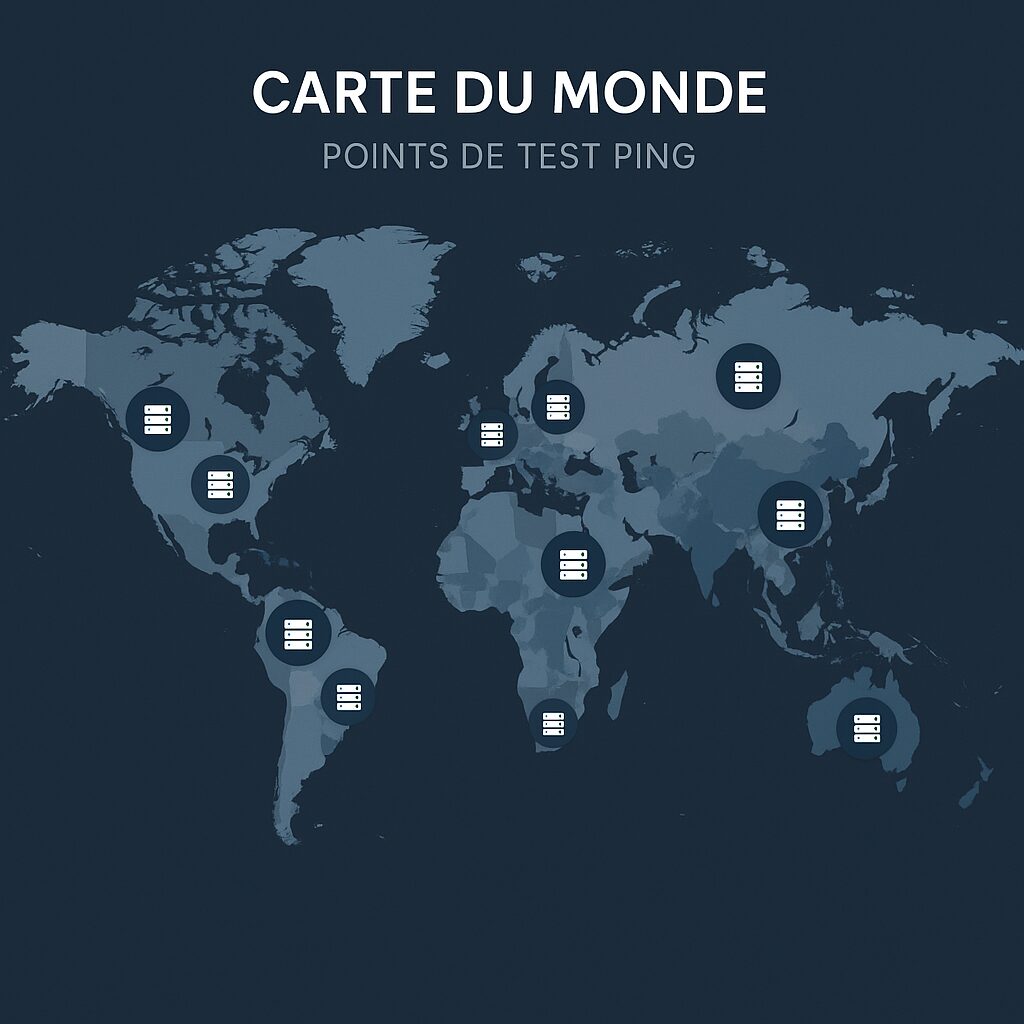
Rank-by-ping.com relies on a network of thousands of test points distributed worldwide. Each point regularly sends ICMP packets to predefined targets and records not only the round-trip delay but also the variance. This data is then aggregated to produce a dynamic ranking, reflecting in real time the performance of each region.
Interface and Key Features
Beyond a simple latency graph, the platform offers:
- A simultaneous comparison mode for multiple servers
- Automatic alerts in case of degradation
- A detailed history with customizable curves
This functional richness facilitates the quick identification of anomalies, even for a network administrator who is not a packet analysis specialist.
Other Measurement Tools
Classic Ping and MTR
ICMP ping remains the most accessible method: it sends a packet and waits for the acknowledgment of receipt. Easy to interpret, its main drawback lies in its sensitivity to filtering rules and processing priorities. MTR (My Traceroute) combines ping and traceroute to trace the path taken, thus offering a view of hops and congestion points.
Professional Monitoring (Pingdom, Datadog, New Relic)
SaaS suites generally integrate agents installed on multiple sites, coupled with remote probes. They measure latency but also availability and web page rendering time. These tools are often more costly, while offering unified dashboards and advanced alerts.
Comparison Methodology
Sampling and Frequency
The reliability of a measurement largely depends on the sample size and the test cadence. Rank-by-ping.com conducts surveys every 30 seconds, while classic pings can be configured more or less frequently by the user. An interval that is too long risks missing occasional spikes, while an interval that is too short can create network overload.
Location of Test Servers
The location of nodes strongly influences the recorded values. A tool whose test network is concentrated in North America may offer excellent results in this region, but less so in Asia or Africa. Rank-by-ping.com ensures balanced coverage, whereas local solutions (e.g., a single datacenter) do not reflect overall performance.
Analysis of Results
Measurement Accuracy
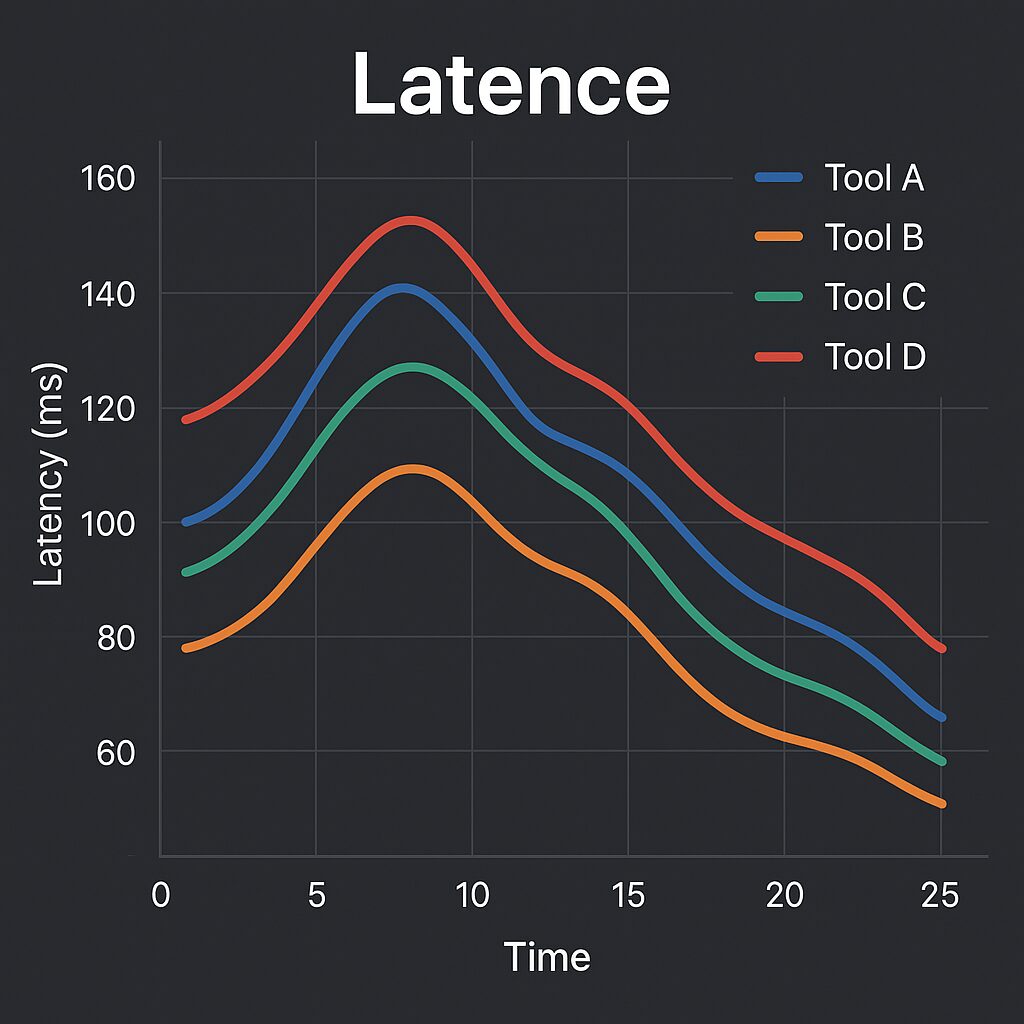
A comparison over several thousand requests reveals that Rank-by-ping.com achieves an average error margin of less than 1 ms, compared to 2 to 3 ms for artisanal tests based on a small number of probes. This difference can prove crucial for applications sensitive to response time, such as algorithmic trading or online gaming.
Variability and Bias
Under congestion conditions, traditional tools often display scattered values, while Rank-by-ping.com smooths these spikes thanks to an outlier filtering algorithm. However, this formatting can mask very short incidents. Therefore, depending on the context, it is advisable to choose between “raw” or averaged values.
Recommendations for Choosing Your Tool
- If you need large quantities of data from various locations, favor a distributed solution like Rank-by-ping.com.
- For occasional local tests, ping and MTR remain a quick and free option.
- When overall monitoring (latency, availability, application performance) is key, consider a complete SaaS platform.
- Remember to adjust the frequency and duration of tests to balance accuracy and network load.
FAQ
What is the main advantage of Rank-by-ping.com compared to a local ping?
The key lies in the geographical diversity of the nodes and in the aggregation of results, which mitigates the effects of local congestion and offers a more global view of latency.
Can I trust the results in case of ICMP filtering?
Most SaaS tools use additional TCP/UDP tests when ICMP is blocked, thus ensuring measurement even on particularly secure networks.
Are latency alerts customizable?
Yes. Most platforms, including Rank-by-ping.com, allow you to set critical thresholds and receive notifications via email, webhook, or SMS.
How can I verify the integrity of my measurements over the long term?
Keep a structured history and compare it to baselines. Prefer regular exports and storage outside the tool to avoid data loss.
What test interval is recommended for a production environment?
A frequency between 30 seconds and 1 minute offers a good compromise between network load and alert responsiveness. For critical applications, go down to 10 seconds.
